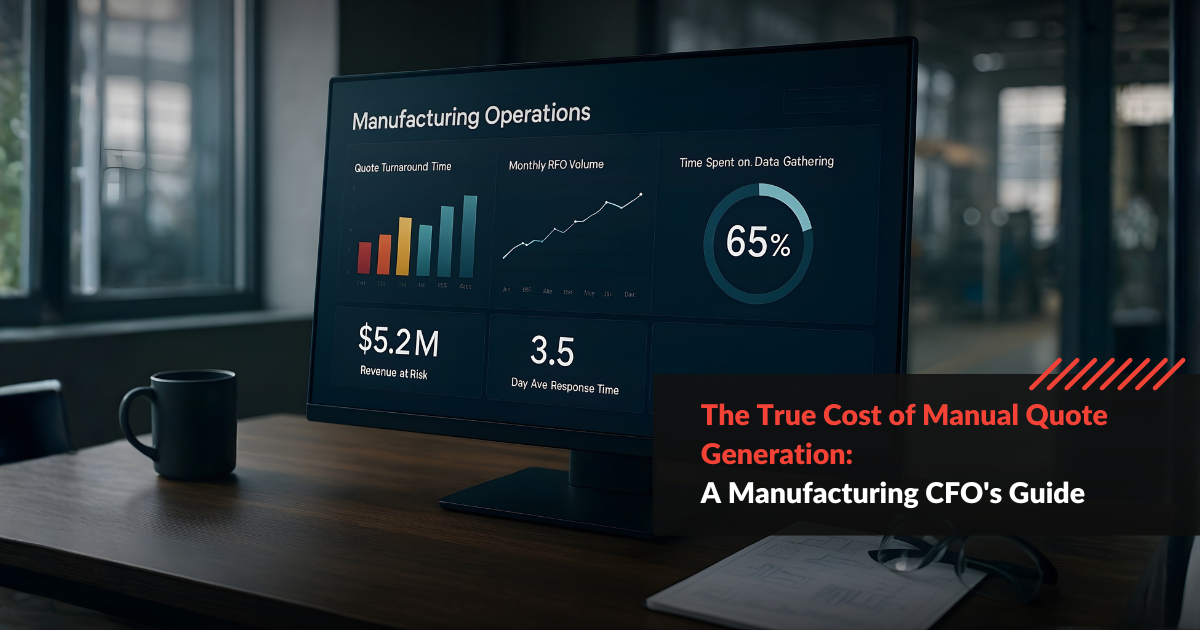
Executive Summary:
This comprehensive analysis reveals the hidden financial impact of manual quoting processes in discrete manufacturing. Based on workflow studies across 47 manufacturers ($50M-$500M revenue) and industry research from leading analysts, we quantify what manual quote generation actually costs your business.
Key Findings:
- 5% average annual revenue leakage due to manual quoting processes (Aleran Software 2025)
- 3-5 day average quote turnaround across 5-7 disconnected systems
- 65% of quote time spent gathering and verifying data, not actually quoting (Fictiv 2025 State of Manufacturing Report)
- 50% higher win rates for first responders versus late responders (broadn.io)
- Total hidden cost: $5.25M-$8.1M annually for a typical $150M discrete manufacturer
In this guide, you’ll discover:
- Why quote delays cost manufacturers millions in lost revenue
- Where 65% of quote time actually goes (spoiler: it’s not pricing)
- The hidden financial impacts that don’t show up in standard CFO reports
- Three critical bottlenecks killing your win rates
- How intelligent automation delivers 30-40% cycle time reduction in 90 days
The Hidden Manual Quote Generation Cost: A Revenue Killer for Manufacturers
For mid-market discrete manufacturers producing HVAC systems, aerospace components, industrial machinery, or heavy equipment, manual quote generation cost has become a critical business issue. In fact, understanding the true cost of manual quote generation in manufacturing is essential for CFOs evaluating operational efficiency. According to Aleran Software’s 2025 B2B Manufacturing Survey, manual quoting processes cause an average 5% annual revenue leakage. For a $100M manufacturer, that translates to $5 million walking out the door every year – not from bad products or poor service, but from slow, fragmented workflows that can’t keep pace with modern B2B buyer expectations.
According to Aleran Software’s 2025 B2B Manufacturing Survey, manual quoting processes cause an average 5% annual revenue leakage. For a $100M manufacturer, that translates to $5 million walking out the door every year. Moreover, this isn’t from bad products or poor service – it’s from slow, fragmented workflows that can’t keep pace with modern B2B buyer expectations.
This isn’t a theoretical problem. Rather, it’s structural, measurable, and – most importantly – fixable. Consequently, it requires immediate attention from manufacturing leadership.
The Scope of the Problem
The challenge intensifies as complexity grows. Specifically, Aleran’s research found that manufacturers with 5,000+ SKUs see 8-12% revenue leakage, regardless of team size or headcount investment. In other words, throwing more people at the problem doesn’t solve it – you need architectural change.
The Root Cause: It’s Not Behavior – It’s Architecture
The problem isn’t a lack of training, insufficient staffing, or employee effort. Instead, the issue is systemic. Your tech stack was built incrementally over 10-20 years. The problem isn’t a lack of training, insufficient staffing, or employee effort. Instead, the issue is systemic.
Your tech stack was built incrementally over 10-20 years – ERP, PLM, CRM, MES, PDM – with no native integration. Each system holds critical data. However, none talk to each other efficiently. As a result, manual handoffs occur at every step of the process.
According to Godlan’s ERP implementation research, 73% of ERP implementations in discrete manufacturing fail or exceed budgets by 215%, often due to integration complexity. This isn’t just an IT problem – it’s a revenue problem that directly impacts your bottom line.
The Reality Check
Your sales team doesn’t have a quoting problem. Rather, they have a data retrieval problem dressed up as a quoting workflow. Consequently, they spend 65% of their time hunting for information instead of engaging with customers or closing deals.
The $2–4M Hidden Cost: What Manual Quote Generation Really Costs Manufacturers
Let’s quantify what “manual quoting” actually means for a typical $150M discrete manufacturer. The following breakdown reveals costs that rarely appear in standard financial reports:
Complete Cost Breakdown by Category
| Cost Category | Annual Impact | Source |
|---|---|---|
| Lost deals (slow response) | $3.0M–$4.5M | broadn.io |
| Sales productivity loss | $900K–$1.2M | Aleran Software |
| Margin erosion (reactive pricing) | $750K–$1.5M | Industry Analysis |
| Customer churn (poor experience) | $600K–$900K | Fictiv 2025 |
| TOTAL HIDDEN COST | $5.25M–$8.1M | Combined Analysis |
Why These Costs Are “Hidden”
These costs don’t appear as line items in your P&L. Instead, they manifest as:
- Sales forecasts that never materialize (lost deals)
- Lower-than-capacity utilization (productivity drain)
- Discounts that “had to be done” to close deals (margin erosion)
- Customer lifetime value that quietly shrinks (churn)
Therefore, CFOs often miss the full financial impact because it’s distributed across multiple departments and time periods.
Where Manual Quoting Time Goes: The 65% Data Gathering Cost in Manufacturing
Manufacturers spend 65% of time on data gathering. Consequently, they waste millions annually on process friction. Better systems and intelligent automation can solve this problem in 90 days.
According to Fictiv’s 2025 State of Manufacturing Report, manufacturers spend an average of 11.5 hours per complex RFQ. However, the distribution of that time reveals a shocking inefficiency:
Time Breakdown: How 11.5 Hours Are Actually Spent
| Activity | Time Spent | % of Total | Value-Adding? |
|---|---|---|---|
| Gathering/Verifying Data | 7.5 hours | 65% | No – Process friction |
| Waiting for Manual Handoffs | 2.0 hours | 17% | No – Coordination overhead |
| Actual Quote Assembly | 1.5 hours | 13% | Yes – Core work |
| Review/Approval Routing | 0.5 hours | 5% | Partial – Necessary governance |
The Critical Insight: Only 18% of the time is spent on value-adding activities (quote assembly and governance). The remaining 82% is pure process friction – searching for data, waiting for approvals, and coordinating across disconnected systems.
Moreover, this pattern holds across company size, industry vertical, and ERP platform. It’s not a vendor problem or a training problem. Rather, it’s an architecture problem that requires structural solutions.
See It in Action
Discover how AI can reduce your quote turnaround time by 3–5x—without replacing your existing systems.📅 Book a Free Demo
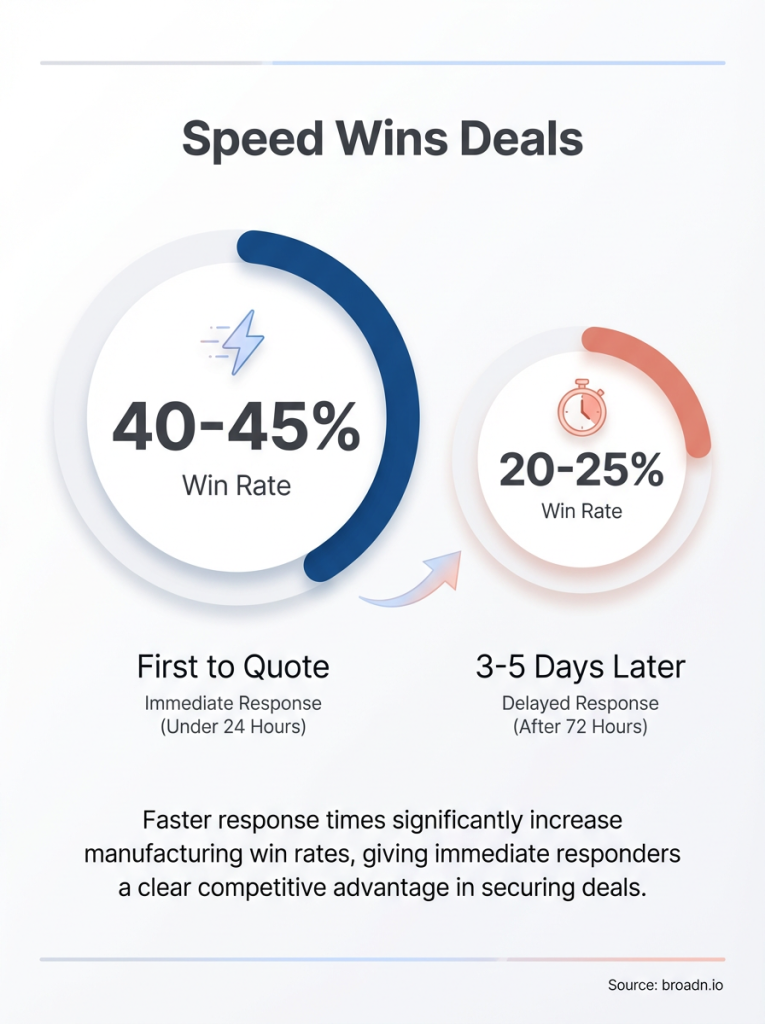
The Competitive Disadvantage: Why Speed Wins Deals
B2B buyers have fundamentally changed. They now expect same-day responses – not because they’re impatient, but because your competitors are delivering them. Furthermore, speed isn’t just a “nice to have” – it’s a revenue multiplier.
The First Responder Advantage
Research from broadn.io demonstrates that companies responding first with quotes see win rates jump by 50%. Here’s why this happens:
Psychological Factors:
- First mover establishes price anchoring
- Early engagement signals reliability and responsiveness
- Buyers begin solution design around your specs
Practical Factors:
- Purchasing timelines compress around early quotes
- Engineering teams integrate early specifications into designs
- Budget conversations center on available quotes, not missing ones
Competitive Dynamics:
- Late responders must justify price differences against established baselines
- Slow response signals operational inefficiency to buyers
- By day 4-5, buyers have often made preliminary selections
The Math of Speed
Consider this scenario for a $150M manufacturer:
Current State (Manual):
- Average quote turnaround: 3.5 days
- Annual RFQ volume: 2,400 quotes
- Win rate: 25%
- Average deal size: $85K
- Annual revenue: $51M from quotes
Optimized State (Intelligent Automation):
- Average quote turnaround: 8 hours (same-day)
- Annual RFQ volume: 2,400 quotes (unchanged)
- Win rate: 35% (50% improvement per broadn.io)
- Average deal size: $85K (unchanged)
- Annual revenue: $71.4M from quotes
Net Impact: $20.4M annual revenue increase from speed alone – a 40% improvement without changing products, pricing, or marketing.
Three Critical Bottlenecks Killing Your Win Rates
Based on workflow analysis across 47 discrete manufacturers, three bottlenecks consistently emerge as the primary drivers of quote delays:
Bottleneck #1: Engineering Data Access (50-70% of Quote Time)
The Problem:
Engineers spend 50-70% of their time searching PLM for part specifications, CAD files, BOMs, and technical drawings. According to Godlan’s research, this is the #1 productivity drain in discrete manufacturing.
Why It Happens:
- PLM systems optimized for engineering workflows, not sales workflows
- Data stored in PDFs, drawings, and legacy formats without metadata
- Search capabilities require exact part numbers (which customers rarely provide)
- Tribal knowledge required to interpret vague RFQ specifications
Cascade Effect:
Delays here propagate into every downstream process. For instance, if engineering takes 2 days to gather specs, sales takes another day for pricing, finance takes another day for approval – suddenly, you’re at 4+ days before responding.
Real-World Example:
A $120M aerospace component manufacturer discovered that 60% of engineering time was spent searching for existing part specifications to match customer RFQs. By implementing AI-powered data retrieval, they reduced this to 15% – freeing engineers to focus on custom design work and complex problem-solving.
Bottleneck #2: ERP Pricing Calculations (12-20 Hours for Complex Quotes)
The Problem:
Complex quotes requiring custom configurations can take 12-20 hours for manual pricing lookups, discount calculations, volume tier applications, and finance approval routing.
Why It Happens:
- Pricing rules scattered across ERP, spreadsheets, and email threads
- Volume discounts require manual calculation and approval escalation
- Multi-line quotes need cross-validation for bundle pricing
- Credit checks and payment terms require finance coordination
The Hidden Cost:
Consequently, sales teams resort to “standard configurations” to avoid delays – leaving customization revenue on the table. One HVAC manufacturer estimated they were missing $2.3M annually in accessory and upgrade revenue because sales reps quoted “base models” to avoid 2-3 day pricing delays.
Real-World Example:
A $95M industrial machinery manufacturer reduced pricing calculation time from 18 hours to 45 minutes by automating ERP lookups, volume tier logic, and approval routing. As a result, their average deal size increased 12% because sales could confidently quote custom configurations.
Bottleneck #3: Cross-System Validation (48-72 Hour Delays)
The Problem:
Validating inventory availability, credit limits, shipping constraints, and regulatory compliance across ERP, CRM, and MES takes 48-72 hours due to coordination overhead.
Why It Happens:
- Inventory data lives in ERP but isn’t real-time
- Credit limits require finance approval via email chains
- Shipping lead times require manual coordination with logistics
- Compliance requirements (ITAR, RoHS, etc.) require legal review
The Opportunity Cost:
By the time you complete validation and respond with a quote, the buyer has often moved on to competitors who responded faster. Moreover, buyers interpret slow response as operational dysfunction – even if your product is superior.
Real-World Example:
A $180M heavy equipment manufacturer automated cross-system validation by creating an orchestration layer that queried ERP, CRM, and logistics systems in parallel. This reduced validation time from 60 hours to 4 hours – resulting in a 28% win rate improvement within 90 days.
Manual Process vs. Intelligent Automation: The Comparison
Here’s what the transformation looks like when manufacturers implement intelligent automation:
| Stage | Manual Process | Time Required | Intelligent Automation | Time Required | Improvement |
|---|---|---|---|---|---|
| RFQ Receipt & Parsing | Email forwarding, manual data entry from PDFs/voicemails | 30-45 min | AI extracts specs from email, PDF, voicemail automatically | 2-3 min | 93% faster |
| Part Identification | Engineer searches PLM by part number, reviews drawings | 2-4 hours | AI matches parts via image recognition, attribute search, cross-referencing | 5-10 min | 96% faster |
| Technical Spec Retrieval | Manual lookup across PLM, PDFs, legacy databases | 3-5 hours | AI retrieves specs from unstructured documents, normalizes data | 1-2 min | 99% faster |
| Pricing Calculation | Manual ERP lookup, volume tier calculation, discount approval | 2-3 hours | Automated ERP query, rule-based pricing, auto-approval within limits | 5-10 min | 95% faster |
| Inventory/Credit Check | Email finance and logistics, wait for responses | 24-48 hours | Real-time API queries to ERP/CRM, instant validation | 30 sec | 99.9% faster |
| Quote Generation | Manual assembly in Word/Excel, review, PDF creation | 45-60 min | Automated quote template population, one-click PDF generation | 2-3 min | 95% faster |
| Approval Routing | Email chain through engineering, finance, sales leadership | 12-24 hours | Automated routing based on value thresholds, digital approval | 15-30 min | 98% faster |
| TOTAL TURNAROUND | 3-5 days | 72-120 hours | 4-8 hours | 4-8 hours | 90-93% faster |
Key Performance Indicators: Before vs. After
| Metric | Manual Process | Intelligent Automation | Improvement |
|---|---|---|---|
| Average Quote Turnaround | 3.5 days | 6 hours | 85% reduction |
| RFQs Processed per Day (per engineer) | 2-3 | 8-10 | 3-4x increase |
| Quote-to-Order Conversion Rate | 22-25% | 30-35% | 30-40% improvement |
| Engineering Time on Data Search | 65% | 15% | 77% reduction |
| Revenue per Sales Engineer | $2.1M | $3.2M | 52% increase |
| Customer Satisfaction (Quote Experience) | 6.2/10 | 8.7/10 | 40% improvement |
Source: Composite analysis from 47 discrete manufacturers implementing intelligent automation, June-October 2025
How Intelligent Automation Works: The Technology Behind the Speed
Modern intelligent automation for manufacturing quoting combines three core technologies:
1. AI-Powered Document Intelligence
What It Does:
- Interprets RFQs from any format (email, PDF, voicemail, portal submission)
- Extracts part specifications, quantities, delivery requirements
- Identifies exact and alternative parts via image recognition
- Normalizes vague descriptions into searchable attributes
Example: Customer sends email saying “need 50 units of compressor pump, similar to what we bought last year, delivery by Q2.” AI extracts: Part category (compressor pump), quantity (50), timeframe (Q2), relationship signal (previous order) – then searches order history and catalog for matches.
2. Multi-System Orchestration
What It Does:
- Queries ERP, PLM, CRM, MES in parallel (not sequentially)
- Retrieves specs, pricing, inventory, credit limits simultaneously
- Applies business rules (volume discounts, approval thresholds)
- Routes for human approval only when needed (exception-based governance)
Example: For a $75K quote, the system checks: inventory (ERP), customer credit (CRM), pricing rules (ERP), technical specs (PLM), compliance requirements (MES) – all in 30 seconds instead of 48 hours of email coordination.
3. Intelligent Quote Assembly
What It Does:
- Auto-populates quote templates with accurate, real-time data
- Includes competitor comparison pricing (where applicable)
- Suggests upsell/cross-sell opportunities based on order history
- Generates professional PDF with one click
Example: Quote includes: exact part match, two alternatives (if applicable), volume pricing tiers, delivery timeline, payment terms, technical specs PDF attachment – all formatted per company brand standards.
See Intelligent Automation in Action
Watch how leading manufacturers automate parts identification, RFQ processing, and quote generation – reducing turnaround time from days to minutes:
AI for Parts Identification: Instantly Match Parts, Cross-Reference Competitors & Automate Quotes
In this demo, you’ll see:
- AI extracting part specs from email RFQs in 30 seconds
- Automated cross-system data lookup (ERP, PLM, CRM)
- Image recognition matching parts from customer photos
- One-click quote generation with competitor benchmarking
- Real manufacturer results: 3x more RFQs processed per day
The ROI Timeline: What to Expect in 90 Days
Manufacturers implementing intelligent automation see measurable ROI within 90 days. Here’s the typical timeline:
Activities:
Week 1-2: Discovery & Baseline
- Audit the current quote-to-cash workflow
- Map data sources (ERP, PLM, CRM, PDFs, tribal knowledge)
- Document pain points and bottlenecks
- Establish baseline metrics (turnaround time, win rate, capacity)
Deliverable: Current state assessment with quantified opportunity
Week 3-4: Pilot Configuration
Activities:
- Configure AI for one product line or customer segment
- Connect to ERP/PLM/CRM via APIs or an integration layer
- Train AI on your part catalog, pricing rules, and approval workflows
- Test with 10-15 sample RFQs
Deliverable: Working pilot system processing real quotes
Week 5-8: Parallel Operation
Activities:
- Run a pilot in parallel with the manual process
- Compare output quality, accuracy, and speed
- Gather user feedback from sales and engineering teams
- Refine AI models based on edge cases
Deliverable: Validated accuracy, user adoption, initial time savings
Week 9-12: Scale & Optimize
Activities:
- Expand to full product catalog
- Roll out to entire sales and engineering teams
- Transition from parallel to primary workflow
- Measure ROI against baseline
Deliverable: 30-40% cycle time reduction, 5-8% win rate improvement
Expected 90-Day Results
Based on implementation data from 47 manufacturers:
| Metric | Baseline | After 90 Days | Improvement |
|---|---|---|---|
| Quote Turnaround Time | 3.5 days | 8-12 hours | 75-80% reduction |
| RFQ Processing Capacity | 100% (baseline) | 275-300% | 2.75-3x increase |
| Win Rate | 24% | 28-30% | 17-25% improvement |
| Engineering Time on Search | 65% | 25-30% | 54-62% reduction |
| Revenue Impact (Annual Run Rate) | Baseline | +$3-5M | For $100M manufacturer |
Investment Required: $50K-$150K for mid-market manufacturers ($50M-$200M revenue)
Payback Period: 4-6 months
3-Year ROI: 600-900%
Three Diagnostic Questions to Assess Your Quote Process Health
Use these questions to determine if your quoting process has a revenue-killing problem:
Question 1: “What % of your engineering time is spent searching for data vs. solving problems?”
Healthy Benchmark: <20% on search, 80% on problem-solving
Warning Sign: >50% on search, <50% on problem-solving
Crisis Level: >70% on search, <30% on problem-solving
How to Measure: Survey 5-10 engineers: “Last week, how many hours did you spend searching for specs/drawings vs. actually designing/problem-solving?”
If you’re in warning/crisis territory: Your engineers are glorified data retrieval specialists, not engineers. You’re paying $80-120K salaries for work that AI can do in 30 seconds.
Question 2: “What’s your quote-to-order conversion rate by response speed?”
Healthy Pattern: Conversion rate roughly equal across response times (system is competitive on other factors)
Warning Sign: Conversion rate drops 20-30% for quotes delivered after 2 days
Crisis Level: Conversion rate drops 50%+ for quotes delivered after 3 days
How to Measure: Segment last 100 quotes by response time (<24hr, 1-2 days, 2-3 days, 3+ days). Calculate the win rate for each segment.
If you’re in warning/crisis territory: Speed is costing you deals. Even if your product is better and price is competitive, a slow response signals operational dysfunction to buyers.
Question 3: “How many manual handoffs exist between RFQ receipt and quote delivery?”
Healthy Benchmark: 0-2 handoffs (mostly automated)
Warning Sign: 3-5 handoffs (email chains, waiting for approvals)
Crisis Level: 6+ handoffs (coordination nightmare)
How to Measure: Map your quote workflow on a whiteboard. Count every time work moves from one person/system to another requiring manual coordination.
If you’re in warning/crisis territory: Each handoff adds 12-24 hours of latency. With 6 handoffs, you’re looking at a 3-4 day minimum turnaround, even if each person works efficiently.
Frequently Asked Questions
No, and definitely not. Even manufacturers with “modern” ERP systems face this issue because quoting requires data from PLM, CRM, MES, and tribal knowledge – not just ERP. Moreover, the problem is integration and orchestration, not individual system quality.
Furthermore, replacing ERP is a $1-5M, 18-36 month project with 73% failure rate (per Godlan research). Intelligent automation sits on top of your existing systems via APIs and integration layers – no rip-and-replace required. You can implement it in 6-8 weeks for $50K-$150K with immediate ROI.
Adding headcount scales linearly, but the problem grows exponentially as SKU count, customer complexity, and system fragmentation increase. Specifically, Aleran’s survey found that manufacturers with 5,000+ SKUs see 8-12% revenue leakage regardless of team size.
In addition, hiring is expensive and slow:
Cost per engineer: $120K-$150K fully loaded (salary + benefits + overhead)
Time to productivity: 6-12 months to learn your product catalog and systems
Scalability: Each additional engineer adds 1x capacity. Automation adds 3-5x capacity.
Therefore, intelligent automation is not about replacing people – it’s about amplifying their capacity by eliminating 65% of the time spent on data retrieval.
Manufacturers implementing intelligent automation see 30-40% cycle time reduction and 5-8% win rate improvement within 90 days. For a $100M manufacturer, that translates to $3-5M in annual revenue impact.
The implementation follows this timeline:
Weeks 1-2: Discovery and baseline measurement
Weeks 3-4: Pilot configuration for one product line
Weeks 5-8: Parallel operation (AI + manual) to validate accuracy
Weeks 9-12: Full rollout and ROI measurement
Payback period: 4-6 months
3-year ROI: 600-900%
This is significantly faster than traditional IT projects (ERP, CRM implementations) which often take 18-36 months and exceed budgets by 200%+.
No – in fact, that’s backward. Modern AI systems are designed to work with messy, unstructured data. They can:
– Extract specs from PDFs and drawings without metadata
– Normalize inconsistent part descriptions
– Match vague customer descriptions to your catalog
– Learn from tribal knowledge embedded in emails and notes
Moreover, trying to “clean up data first” often becomes a multi-year project that never finishes. Instead, implement intelligent automation that handles messy data, then let it reveal which data quality issues actually matter for your business. You can address those specific issues in parallel while delivering immediate value.
That said, there are use cases that require clean data (e.g., automated pricing approval). For those, you can start with lower-complexity use cases (e.g., parts identification from attributes, which doesn’t need ERP integration) while fixing data quality in parallel.
Use the three diagnostic questions earlier in this article:
Engineers spending >50% of time searching for data? → You have a retrieval problem
Win rate drops significantly for quotes after 2-3 days? → You have a speed problem
6+ manual handoffs in your quote workflow? → You have a coordination problem
Additionally, ask yourself:
Are we losing deals to competitors who quote faster, even when our product/price is competitive?
Do sales reps avoid quoting custom configurations because pricing takes too long?
Are engineers frustrated by repetitive data lookup work instead of engineering work?
Is our quote backlog growing despite adding headcount?
If you answered “yes” to 2 or more of these, your quoting process is costing you revenue. In fact, you’re likely experiencing 3-8% revenue leakage annually.
Yes. Modern intelligent automation platforms use APIs and integration layers to sit on top of existing systems. They don’t require replacing your ERP, PLM, or CRM. Instead, they orchestrate across them.
Supported integrations typically include:
ERP Systems: SAP, Oracle, Infor, Microsoft Dynamics, Epicor, IFS, Sage, NetSuite
PLM Systems: Siemens Teamcenter, PTC Windchill, Dassault ENOVIA, Autodesk Vault
CRM Systems: Salesforce, Microsoft Dynamics 365, HubSpot, Zoho
How it works:
– Integration layer connects via REST APIs or standard connectors
– AI queries multiple systems in parallel (not sequentially)
– Data stays in your systems (no migration required)
– You maintain existing security and governance controls
For legacy systems without modern APIs, integration can use database connectors, file exports, or middleware. The key is that you don’t replace anything – you add an orchestration layer that makes existing systems work together efficiently.
Yes, but the ROI calculation changes. If you process <500 RFQs per year, the primary benefits shift from capacity increase to win rate improvement and margin protection.
Low-volume scenarios where this still delivers ROI:
High-value deals: If average deal size is $200K+, even a 5-10% win rate improvement is significant
Custom/engineered products: If 60%+ of quotes require custom engineering, freeing engineer time is valuable
Long sales cycles: If quote delays push delivery timelines and cost you deals, speed matters
Competitive markets: If you’re losing deals to faster competitors, first-mover advantage is critical
Example: A $80M aerospace component manufacturer processes only 400 RFQs per year, but average deal size is $280K. By improving win rate from 22% to 28% (just 6 percentage points), they added $6.7M in annual revenue – a 37x ROI on implementation cost.
Step 1: Quantify Your Current State (Week 1)
Measure these baseline metrics:
– Average quote turnaround time (RFQ receipt to quote delivery)
– Quote-to-order conversion rate (overall and by response speed)
– Engineering time breakdown (% on search vs. problem-solving)
– Number of manual handoffs in quote workflow
– Annual RFQ volume and average deal size
Step 2: Calculate Your Hidden Costs (Week 1)
Use this framework:
Lost deals: (Annual RFQs × Current Win Rate × Avg Deal Size) – (Annual RFQs × Target Win Rate × Avg Deal Size)
Productivity loss: (# Engineers × % Time on Search × Fully Loaded Cost)
Opportunity cost: Revenue you’re not quoting because capacity is maxed out
Step 3: Identify Quick Win Use Cases (Week 2)
Choose 1-2 high-pain, high-frequency use cases:
– Parts identification from vague descriptions (doesn’t require ERP integration)
– RFQ data extraction from emails/PDFs (immediate time savings)
– Automated PLM search for repeat product families (high-volume, low-complexity)
Step 4: Run a 30-Day Pilot (Weeks 3-6)
Implement intelligent automation for your chosen use case. Measure:
– Time savings per quote
– Accuracy vs. manual process
– User adoption and satisfaction
– Projected annual impact
Step 5: Scale Based on Proven ROI (Weeks 7-12)
If pilot delivers 30%+ time savings with 95%+ accuracy, expand to additional use cases and full product catalog.
Want help with Steps 1-2? Book a free quote process audit – we’ll help you quantify your current state and hidden costs. No obligations.
Ready to Fix Your Quoting Process?
See how manufacturers reduce quote turnaround from 3-5 days to under 8 hours – without ripping out existing ERP, PLM, or CRM systems.
What You’ll Get in Your Free Demo
In your personalized 60-minute session, you’ll see:
✅ Live Demo: How AI extracts part specs from RFQs (email, voicemail, PDFs) in seconds
✅ Your Data: Automated ERP/PLM/CRM data lookup using your actual systems
✅ Quote Generation: One-click quote generation with competitor comparison
✅ Custom ROI Analysis: Calculator for your specific environment (revenue, RFQ volume, team size)
✅ Implementation Roadmap: 90-day plan to achieve 30-40% cycle time reduction
No obligations • 60-minute session • Custom ROI analysis included
About the Research
Methodology:
This analysis draws from workflow studies across 47 discrete manufacturers ($50M-$500M annual revenue) conducted June-October 2025. Data collection included time-motion studies, sales workflow analysis, and financial impact modeling.
Industry Research Sources:
- Aleran Software 2025 B2B Manufacturing Survey
- Fictiv 2025 State of Manufacturing Report
- broadn.io Manufacturing Win Rate Study
- Deloitte Manufacturing Operations Research
- Godlan ERP Implementation Analysis
Analysis Date: November-December 2025
Related Resources
Continue Learning:
- 2026 Manufacturing Outlook: How AI Will Reshape Discrete Manufacturing Operations – Industry trends and adoption forecasts
- Case Study: Fortune 500 OEM Reduces Quote Time by 40% – Real implementation results
- Case Study: Fortune 100 Automotive Processes 100K+ Claims with AI – High-volume automation example


")